0

I have this query in my .phtml file.

//Retrieve the read connection
$readConnection     = Mage::getSingleton('core/resource')->getConnection('core_read');
$sql = "SELECT DATE_FORMAT(created_at,'%d-%m-%Y') AS order_date,COUNT(entity_id) AS total_orders 
        FROM sales_flat_order
        WHERE DATE_FORMAT(created_at,'%Y-%m-%d') >= '2018-01-01'
        GROUP BY DATE_FORMAT(created_at,'%Y-%m-%d')";
$result = $readConnection->fetchAll($sql);

I want to generate chart using this data without install any extension.

    +---------------+--------------+
    | Order Date    | Total orders |
    +---------------+--------------+
    | 01-01-2018    | 287          |
    +---------------+--------------+
    | 05-01-2018    | 125          |
    +---------------+--------------+
    | 07-01-2018    | 27           |
    +---------------+--------------+
    | 10-01-2018    | 75           |
    +---------------+--------------+

Can I do it..?

1 Answer 1

0

I used the following method for generate charts.

It may helpful to anyone.

$readConnection     = Mage::getSingleton('core/resource')->getConnection('core_read');
$sql = "SELECT DATE_FORMAT(created_at,'%d-%m-%Y') AS order_date,COUNT(entity_id) AS total_orders 
        FROM sales_flat_order
        WHERE DATE_FORMAT(created_at,'%Y-%m-%d') >= '2018-01-01'
        GROUP BY DATE_FORMAT(created_at,'%Y-%m-%d') 
        ORDER BY total_orders DESC
        LIMIT 5";
$result = $readConnection->fetchAll($sql);
$content = "<table style='border-spacing: 8px;border: 2px solid #f3a1a1;'>";
foreach($result as $row)
{
    $arr[$row['order_date']] =$row['total_orders'];
    $content .= "<tr style='background-color: #f5d5d9;'><td>".$row['order_date']."</td><td>".$row['total_orders']."</td></tr>";
}
$content .= "</table>";
foreach($arr as $arrval=>$arrkey)
{
    $incarr.= "['".$arrval ."',". $arrkey ."],";
}
$content .='<script type="text/javascript" src="https://www.google.com/jsapi"></script>
    <script type="text/javascript">';
    $data = 'google.visualization.arrayToDataTable([
          ["Date", "Orders per Day"],'.$incarr.'])';
          $content.='google.load("visualization", "1", {packages:["corechart"]});
      google.setOnLoadCallback(drawChart);
      function drawChart() {
          var options = {
          title: "Order Statistics",
          width: 900,
    height: 450,
          is3D: true,
          pieSliceText: "value",
        };
        var chart = new google.visualization.PieChart(document.getElementById("piechart"));
         chart.draw('.$data.', options);
      }
</script>';
$content.="<div id='piechart' style='width: 900px; height: 500px;align:center'></div><br/>";
echo $content;

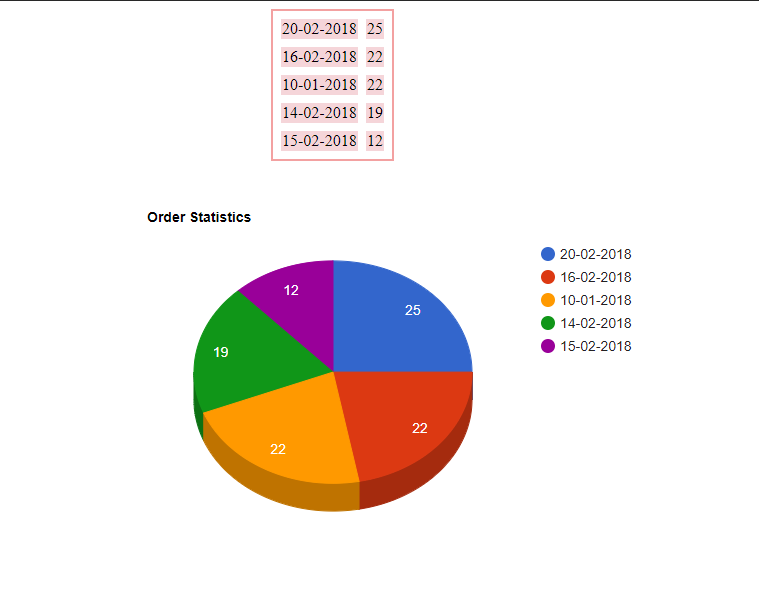
Output will be : enter image description here

Your Answer

By clicking “Post Your Answer”, you agree to our terms of service and acknowledge you have read our privacy policy.

Not the answer you're looking for? Browse other questions tagged or ask your own question.