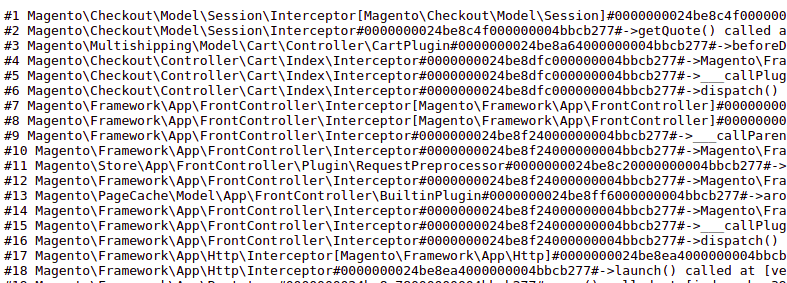
In magento 1.x we can use backtrace like
echo Varien_Debug::backtrace(true, true); exit;
How can we use this facility in Magento 2?
You can use debug_backtrace() as I added below.
$debugBackTrace = debug_backtrace(DEBUG_BACKTRACE_IGNORE_ARGS);
foreach ($debugBackTrace as $item) {
    echo @$item['class'] . @$item['type'] . @$item['function'] . "\n";
}
For reference please check
dev\tests\api-functional\framework\Magento\TestFramework\TestCase\Webapi\Adapter\Rest\DocumentationGenerator.php
@ to ignore warnings, for instance when 'class' doesn't exist)
launch
In the logger classes of Magento 2, the debug_backtrace method is not used directly.
So the Magento 2 way of doing backtrace is to use the Magento\Framework\Debug class (which is the equivalent of the M1 Varien_Debug class) and call the backtrace() method:
/**
 * Prints or returns a backtrace
 *
 * @param bool $return      return or print
 * @param bool $html        output in HTML format
 * @param bool $withArgs    add short arguments of methods
 * @return string|bool
 */
public static function backtrace($return = false, $html = true, $withArgs = true)
{
    $trace = debug_backtrace();
    return self::trace($trace, $return, $html, $withArgs);
}
In any PHP application you can just do:
$e = new \Exception();
echo '<pre>';
print_r($e->getTraceAsString());
exit;
Due to name spacing in M2, you need to use new \Exception(); instead of just new Exception();
print_r((new \Exception())->getTraceAsString()); (since PHP 5.4, so safe to use in M2)
This could also work:
$writer = new \Zend\Log\Writer\Stream(BP . '/var/log/custom.log');
$logger = new \Zend\Log\Logger();
$logger->addWriter($writer);
$debugBackTrace = debug_backtrace(DEBUG_BACKTRACE_IGNORE_ARGS);
foreach ($debugBackTrace as $item) {
    $logger->info(@$item['class'] . @$item['type'] . @$item['function']);
}
If you want to see all of the classes and methods called, in a custom log file .
You can use PHP function debug_backtrace to debugging in Magento.
Use following code in magento to track the issue by using debug_backtrace
foreach (debug_backtrace() as $_stack) {
    echo ($_stack["file"] ? $_stack["file"] : '') . ':' .
        ($_stack["line"] ? $_stack["line"] : '') . ' - ' .
        ($_stack["function"] ? $_stack["function"] : '').'<br/><hr/>';
 }
exit();
You will see the debug backtrace that will allow you to define the issue source and you will get an idea how to fix the issue.
Try this:
\Magento\Framework\Debug::backtrace(false, true, false);
exit();
Or use this if you want to get the response in a logfile:
$writer = new \Zend\Log\Writer\Stream(BP . '/var/log/zend_debug.log');
$logger = new \Zend\Log\Logger();
$logger->addWriter($writer);

$response = \Magento\Framework\Debug::backtrace(true, false, false);
$logger->info($response);
you can use the native Magento backtrace function from the \Magento\Framework\Debug class and call it whenever you need:
\Magento\Framework\Debug::backtrace(false, true, false);
As a result, you will get this nice HTML debug-backtrace:

If you don't like the look of the default Magento backtrace, you can use a custom function and Just copy this code into your PHP class temporarily:
public static function debugHtmlBacktrace($title = '') {
     $result = '';
     foreach(debug_backtrace() as $_stack) {
         $result .= '<tr>
             <td>' . (isset($_stack['file']) ? $_stack['file'] : '') . '</td>
             <td>' . (isset($_stack['line']) ? $_stack['line'] : '') . '</td>
             <td>' . (isset($_stack['function']) ? $_stack['function'] : '') . '</td>
         </tr>';
    }

    return '<br/>' . $title . '<table border="1">
         <tr><td>File</td><td>Line</td><td>Function</td></tr>' . $result . '</table>';
 }
and execute it by:
echo self::debugHtmlBacktrace();