0

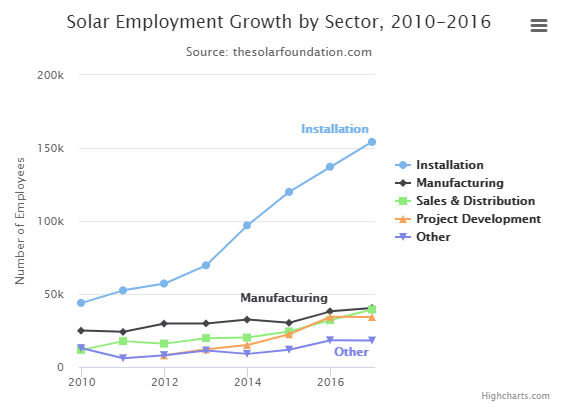
I need to use the Highcharts.com simple line graph by adding its library with requirejs-config.js in frontend luma theme, custom module in customer account section.

enter image description here

I have tried these solutions but till now it dosent work. https://magento.stackexchange.com/a/144867/49186 https://magento.stackexchange.com/a/149020/49186

and also tried the <link src="Vendorname_module::js/highcharts/highcharts.js"/> in my layout.xml . The js file loads but the Highcharts object dosent create.

Still facing this issue.

Please help me in using the standard most recommended way to do this.

2 Answers 2

0

requirejs-config.js

var config = {

packages: [{
    name: 'highcharts',
    main: 'highcharts'
}],

paths: {

    'highcharts': 'https://code.highcharts.com'

}

}

your phtml

<div id="containerxxx" style="height: 400px"></div>

<div id="containeryyy" style="height: 400px"></div>

<script type="text/javascript">
    require(['jquery', 'highcharts',
        'highcharts/modules/exporting',
        'highcharts/modules/accessibility'], function ($, Highcharts) {
        $(document).ready(function ($) {

            // ******************************* Extras ***************************************************

            Highcharts.wrap(Highcharts.Axis.prototype, 'getLinePath', function (proceed, lineWidth) {
                var axis = this,
                    path = proceed.call(this, lineWidth),
                    x = path[1],
                    y = path[2];

                Highcharts.each(this.breakArray || [], function (brk) {
                    if (axis.horiz) {
                        x = axis.toPixels(brk.from);
                        path.splice(3, 0,
                            'L', x - 4, y, // stop
                            'M', x - 9, y + 5, 'L', x + 1, y - 5, // left slanted line
                            'M', x - 1, y + 5, 'L', x + 9, y - 5, // higher slanted line
                            'M', x + 4, y
                        );
                    } else {
                        y = axis.toPixels(brk.from);
                        path.splice(3, 0,
                            'L', x, y - 4, // stop
                            'M', x + 5, y - 9, 'L', x - 5, y + 1, // lower slanted line
                            'M', x + 5, y - 1, 'L', x - 5, y + 9, // higher slanted line
                            'M', x, y + 4
                        );
                    }
                });
                return path;
            });


            var pointBreakColumn = function (e) {
                var point = e.point,
                    brk = e.brk,
                    shapeArgs = point.shapeArgs,
                    x = shapeArgs.x,
                    y = this.translate(brk.from, 0, 1, 0, 1),
                    w = shapeArgs.width,
                    key = ['brk', brk.from, brk.to],
                    path = ['M', x, y, 'L', x + w * 0.25, y + 4, 'L', x + w * 0.75, y - 4, 'L', x + w, y];

                if (!point[key]) {
                    point[key] = this.chart.renderer.path(path)
                        .attr({
                            'stroke-width': 2,
                            stroke: point.series.options.borderColor
                        })
                        .add(point.graphic.parentGroup);
                } else {
                    point[key].attr({
                        d: path
                    });
                }
            };


// *****************************************************************
            Highcharts.chart('containeryyy', {
                chart: {
                    type: 'column'
                },
                title: {
                    text: 'Visualized axis break'
                },
                xAxis: {
                    categories: ['Jan', 'Feb', 'Mar', 'Apr', 'May', 'Jun', 'Jul', 'Aug', 'Sep', 'Oct', 'Nov', 'Dec']
                },
                yAxis: {
                    lineColor: 'black',
                    lineWidth: 2,
                    title: false,
                    tickInterval: 100,
                    breaks: [{
                        from: 500,
                        to: 3000
                    }],
                    events: {
                        pointBreak: pointBreakColumn
                    }
                },
                series: [{
                    name: 'Attraction 1',
                    data: [44, 128, 180, 345, 3050, 3590, 3840, 3630, 3120, 420, 240, 80]
                }, {
                    name: 'Attraction 2',
                    data: [64, 138, 164, 408, 3120, 3540, 3875, 3420, 720, 320, 160, 20]
                }]

            });

            Highcharts.chart('containerxxx', {
                chart: {
                    type: 'column'
                },
                title: {
                    text: 'World\'s largest cities per 2017'
                },
                subtitle: {
                    text: 'Source: <a href="http://en.wikipedia.org/wiki/List_of_cities_proper_by_population">Wikipedia</a>'
                },
                xAxis: {
                    type: 'category',
                    labels: {
                        rotation: -45,
                        style: {
                            fontSize: '13px',
                            fontFamily: 'Verdana, sans-serif'
                        }
                    }
                },
                yAxis: {
                    min: 0,
                    title: {
                        text: 'Population (millions)'
                    }
                },
                legend: {
                    enabled: false
                },
                tooltip: {
                    pointFormat: 'Population in 2017: <b>{point.y:.1f} millions</b>'
                },
                series: [{
                    name: 'Population',
                    data: [
                        ['Shanghai', 24.2],
                        ['Beijing', 20.8],
                        ['Karachi', 14.9],
                        ['Shenzhen', 13.7],
                        ['Guangzhou', 13.1],
                        ['Istanbul', 12.7],
                        ['Mumbai', 12.4],
                        ['Moscow', 12.2],
                        ['São Paulo', 12.0],
                        ['Delhi', 11.7],
                        ['Kinshasa', 11.5],
                        ['Tianjin', 11.2],
                        ['Lahore', 11.1],
                        ['Jakarta', 10.6],
                        ['Dongguan', 10.6],
                        ['Lagos', 10.6],
                        ['Bengaluru', 10.3],
                        ['Seoul', 9.8],
                        ['Foshan', 9.3],
                        ['Tokyo', 9.3]
                    ],
                    dataLabels: {
                        enabled: true,
                        rotation: -90,
                        color: '#FFFFFF',
                        align: 'right',
                        format: '{point.y:.1f}', // one decimal
                        y: 10, // 10 pixels down from the top
                        style: {
                            fontSize: '13px',
                            fontFamily: 'Verdana, sans-serif'
                        }
                    }
                }]
            });


        });
    });
</script>
-1

OK I got the solution for a working graph for starters... In my case, here is what worked.

Vendorname/Modulename/view/frontend/requirejs-config.js

file has following code:

var config = {
    paths: {
        'highchart': "Vendorname_Modulename/js/highcharts/highcharts"
    },
    shim: {
        'highchart': {
            deps: ['jquery']
        }
    }
}

I put my highcharts.js in the following way:

Vendorname/Modulename/view/frontend/web/js/highcharts/highcharts.js

Now in my template file:

Vendorname/Modulename/view/frontend/templates/account/userDashboard.phtml

<script type="text/javascript">
       require([
        "jquery",
        "highchart",
        //"domReady!"
    ], function ($, highchart) {

        var myChart = highchart.chart('container', {
            chart: {
                type: 'area'
            },
            title: {
                text: 'My Completed Tasks'
            },
            xAxis: {
                allowDecimals: false,
                labels: {
                    formatter: function () {
                        return this.value; 
                    }
                }
            },
            yAxis: {
                title: {
                    text: 'Counts'
                },
                labels: {
                    formatter: function () {
                      return this.value;
                    }
                }
            },
            tooltip: {
                pointFormat: '{series.name} had completed <b>{point.y:,.0f}</b><br/>Tasks in {point.x}'
            },
            plotOptions: {
                area: {
                    pointStart: 2007,
                    marker: {
                        enabled: false,
                        symbol: 'circle',
                        radius: 2,
                        states: {
                            hover: {
                                enabled: true
                            }
                        }
                    }
                }
            },
            series: [{
                    name: 'Total',
                    data: [
                        null, 6, 11, 32, 110, 235,
                        369, 640,500,425,300,280
                    ]
                },{
                    name: 'Tasks',
                    data: [
                        13, 20, 45, 30, 135,
                        200, 130,150,55,80,64,0 
                    ]
                }
            ]
        });
    });
</script>

Further need add the data dynamically from php variables for making graph dynamic.

Hope this helps someone some day!

Also if this can be improved for more better way, please do add.

1
  • its not work in my module . may be you have miss somethings here
    – HaFiz Umer
    Commented Jul 2, 2019 at 13:25

Your Answer

By clicking “Post Your Answer”, you agree to our terms of service and acknowledge you have read our privacy policy.

Not the answer you're looking for? Browse other questions tagged or ask your own question.